The caching component of Picasso is fundamental to its awesomeness. Especially when your app deals with a lot of (large) images, fine-tuned caches are important for a fluent and neat user experience.
Last week, we've looked at forcing Picasso to skip certain caches. This week, we'll show you options how to check the success of your customizations.
Picasso Series Overview
- Influencing Image Caching
- Cache Indicators, Logging & Stats
- Catching and Analyzing Errors
- Log Image Loading with Stetho and Chrome Developer Tools
Cache Indicators
If you haven't skipped all the previous blog posts in this series, you should know by now that Picasso utilizes two caches: disk and memory. The last resort is to load the image from the network, which is expensive and slow.
As a developer, it's important to be able to analyze where an image came from. The easiest option to do that is to activate the caching indicators. Simply call .setIndicatorsEnabled(true); once on your Picasso instance:
Picasso
    .with(context)
    .setIndicatorsEnabled(true);
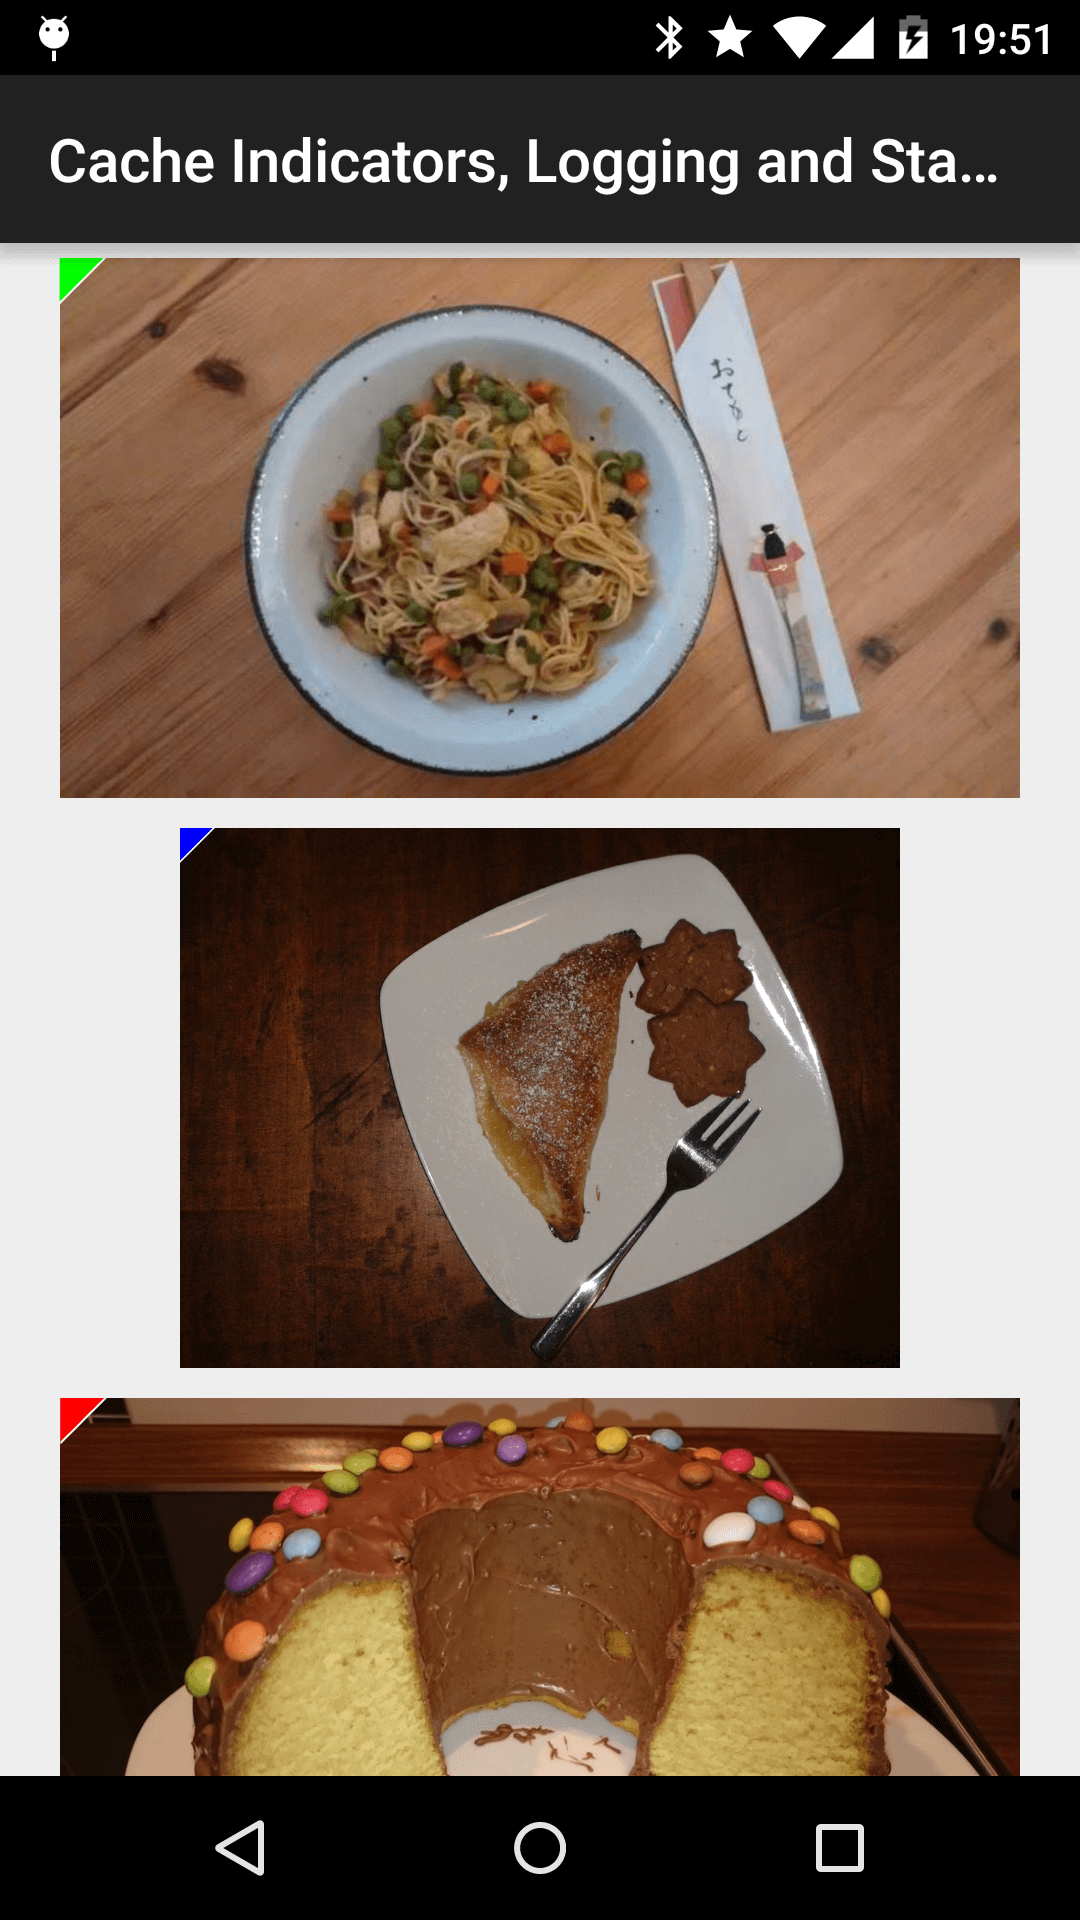
All following image requests will have a small indicator on the top left corner:

The color represents a source:
- green (memory, best performance)
- blue (disk, good performance)
- red (network, worst performance).
Logging
The color indicators often already solve the problem of slowly loading images, since it should assist you in detecting a cache issue. However, if a situation still isn't cleared up, consider activating the logs by calling .setLoggingEnabled(true) on your Picasso instance (this option is by default set to false).
Picasso
    .with(context)
    .setLoggingEnabled(true);
This will result in all future Picasso requests to have logs printed to the Android logcat (until you call .setLoggingEnabled(false)). Once the image requests are initiated, watch the Android logcat for detailed information about the request. Picasso will print all relevant data.
For example, this Picasso call forces the image to be loaded from the network:
Picasso
    .with(context)
    .load(UsageExampleListViewAdapter.eatFoodyImages[2])
    .memoryPolicy(MemoryPolicy.NO_CACHE)
    .networkPolicy(NetworkPolicy.NO_CACHE)
    .into(imageViewFromNetwork);
It would create the similar output on the Android logcat:
D/Picasso﹕ Main        created      [R0] Request{http://i.imgur.com/rT5vXE1.jpg}
D/Picasso﹕ Dispatcher  enqueued     [R0]+21ms
D/Picasso﹕ Hunter      executing    [R0]+26ms
D/Picasso﹕ Hunter      decoded      [R0]+575ms
D/Picasso﹕ Dispatcher  batched      [R0]+576ms for completion
D/Picasso﹕ Main        completed    [R0]+807ms from NETWORK
D/Picasso﹕ Dispatcher  delivered    [R0]+809ms
StatsSnapshot
Last, but not least, you've the option to look at the bigger picture. Instead of analyzing single requests, you can get accumulated and averaged results by looking at the StatsSnapshot.
In order to gain access to the data, simply call:
StatsSnapshot picassoStats = Picasso.with(context).getSnapshot();
The returned object can either be analyzed in the debugger, or printed to the Android logcat with:
Log.d("Picasso Stats", picassoStats.toString());
The output of our small sample app would look like this:
D/Picasso Stats﹕ StatsSnapshot{
maxSize=28760941,
size=26567204,
cacheHits=30,
cacheMisses=58,
downloadCount=0,
totalDownloadSize=0,
averageDownloadSize=0,
totalOriginalBitmapSize=118399432,
totalTransformedBitmapSize=96928004,
averageOriginalBitmapSize=2466654,
averageTransformedBitmapSize=2019333,
originalBitmapCount=48,
transformedBitmapCount=41,
timeStamp=1432576918067}
Outlook
Please make sure none of the above options are configured in a production environment! The caching indicators will look weird to unsuspecting users and the logging option can actually slow the app down.
In this blog post, you've seen how to visualize and check the hit rates of Picasso's caches and print the overall request statistics.
Next week, we'll move towards a very advanced topic: we'll use the Picasso.Builder to make changes to the Picasso instance itself.
