In previous tutorials, you've learned how to log requests and responses in Retrofit with an OkHttp interceptor, and to analyze network traffic with facebook's stetho tool. While the OkHttp interceptor is a fast and easy setup, and Stetho offers better analysis, both are limited in their logging capabilities.
In this tutorial, you'll learn how to use Android Studio's Android Profiler to really drill into details of your app's network traffic. You'll also see how to correlate UI events, CPU and memory behavior to network requests. The best part: all of this requires no code setup!
Retrofit Series Overview
- Getting Started and Creating an Android Client
- Basics of API Description
- Creating a Sustainable Android Client
- URL Handling, Resolution and Parsing
- How to Change API Base Url at Runtime
- Multiple Server Environments (Develop, Staging, Production)
- Share OkHttp Client and Converters between Retrofit Instances
- Upgrade Guide from 1.9
- Beyond Android: Retrofit for Java Projects
- How to use OkHttp 3 with Retrofit 1
- Synchronous and Asynchronous Requests
- Send Objects in Request Body
- Add Custom Request Header
- Manage Request Headers in OkHttp Interceptor
- Dynamic Request Headers with @HeaderMap
- Multiple Query Parameters of Same Name
- Optional Query Parameters
- Send Data Form-Urlencoded
- Send Data Form-Urlencoded Using FieldMap
- How to Add Query Parameters to Every Request
- Add Multiple Query Parameter With QueryMap
- How to Use Dynamic Urls for Requests
- Constant, Default and Logic Values for POST and PUT Requests
- Cancel Requests
- Reuse and Analyze Requests
- Optional Path Parameters
- How to Send Plain Text Request Body
- Customize Network Timeouts
- How to Trust Unsafe SSL certificates (Self-signed, Expired)
- Dynamic Endpoint-Dependent Interceptor Actions
- How to Update Objects on the Server (PUT vs. PATCH)
- How to Delete Objects on the Server
- Introduction to (Multiple) Converters
- Adding & Customizing the Gson Converter
- Implementing Custom Converters
- How to Integrate XML Converter
- Access Mapped Objects and Raw Response Payload
- Supporting JSON and XML Responses Concurrently
- Handling of Empty Server Responses with Custom Converter
- Send JSON Requests and Receive XML Responses (or vice versa)
- Unwrapping Envelope Responses with Custom Converter
- Wrapping Requests in Envelope with Custom Converter
- Define a Custom Response Converter
- Log Requests and Responses
- Enable Logging for Development Builds Only
- Log Network Traffic with Stetho and Chrome Developer Tools
- Using the Log Level to Debug Requests
- Analyze Network Traffic with Android Studio Profiler
- Debug and Compare Requests with RequestBin
Prerequisites & Setup
Unlike the OkHttp interceptor and Stetho you won't have to make any changes to your code. This solution works out-of-the-box with Android Studio 3.0.
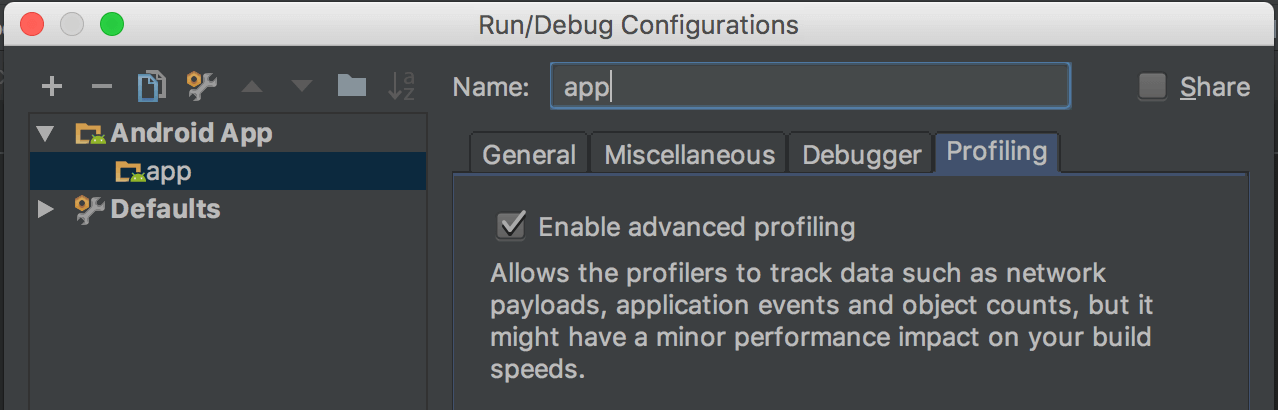
However, at the moment you still need to enable advanced profiling in your run/debug configuration. When you run the app with this updated configuration, you'll be able to use the Android Profiler to analyze your app's network traffic.
Analyze Network Traffic with Android Profiler
Once your app is running on a device or emulator, you can use the Android Profiler view to analyze UI, CPU, memory and network details.
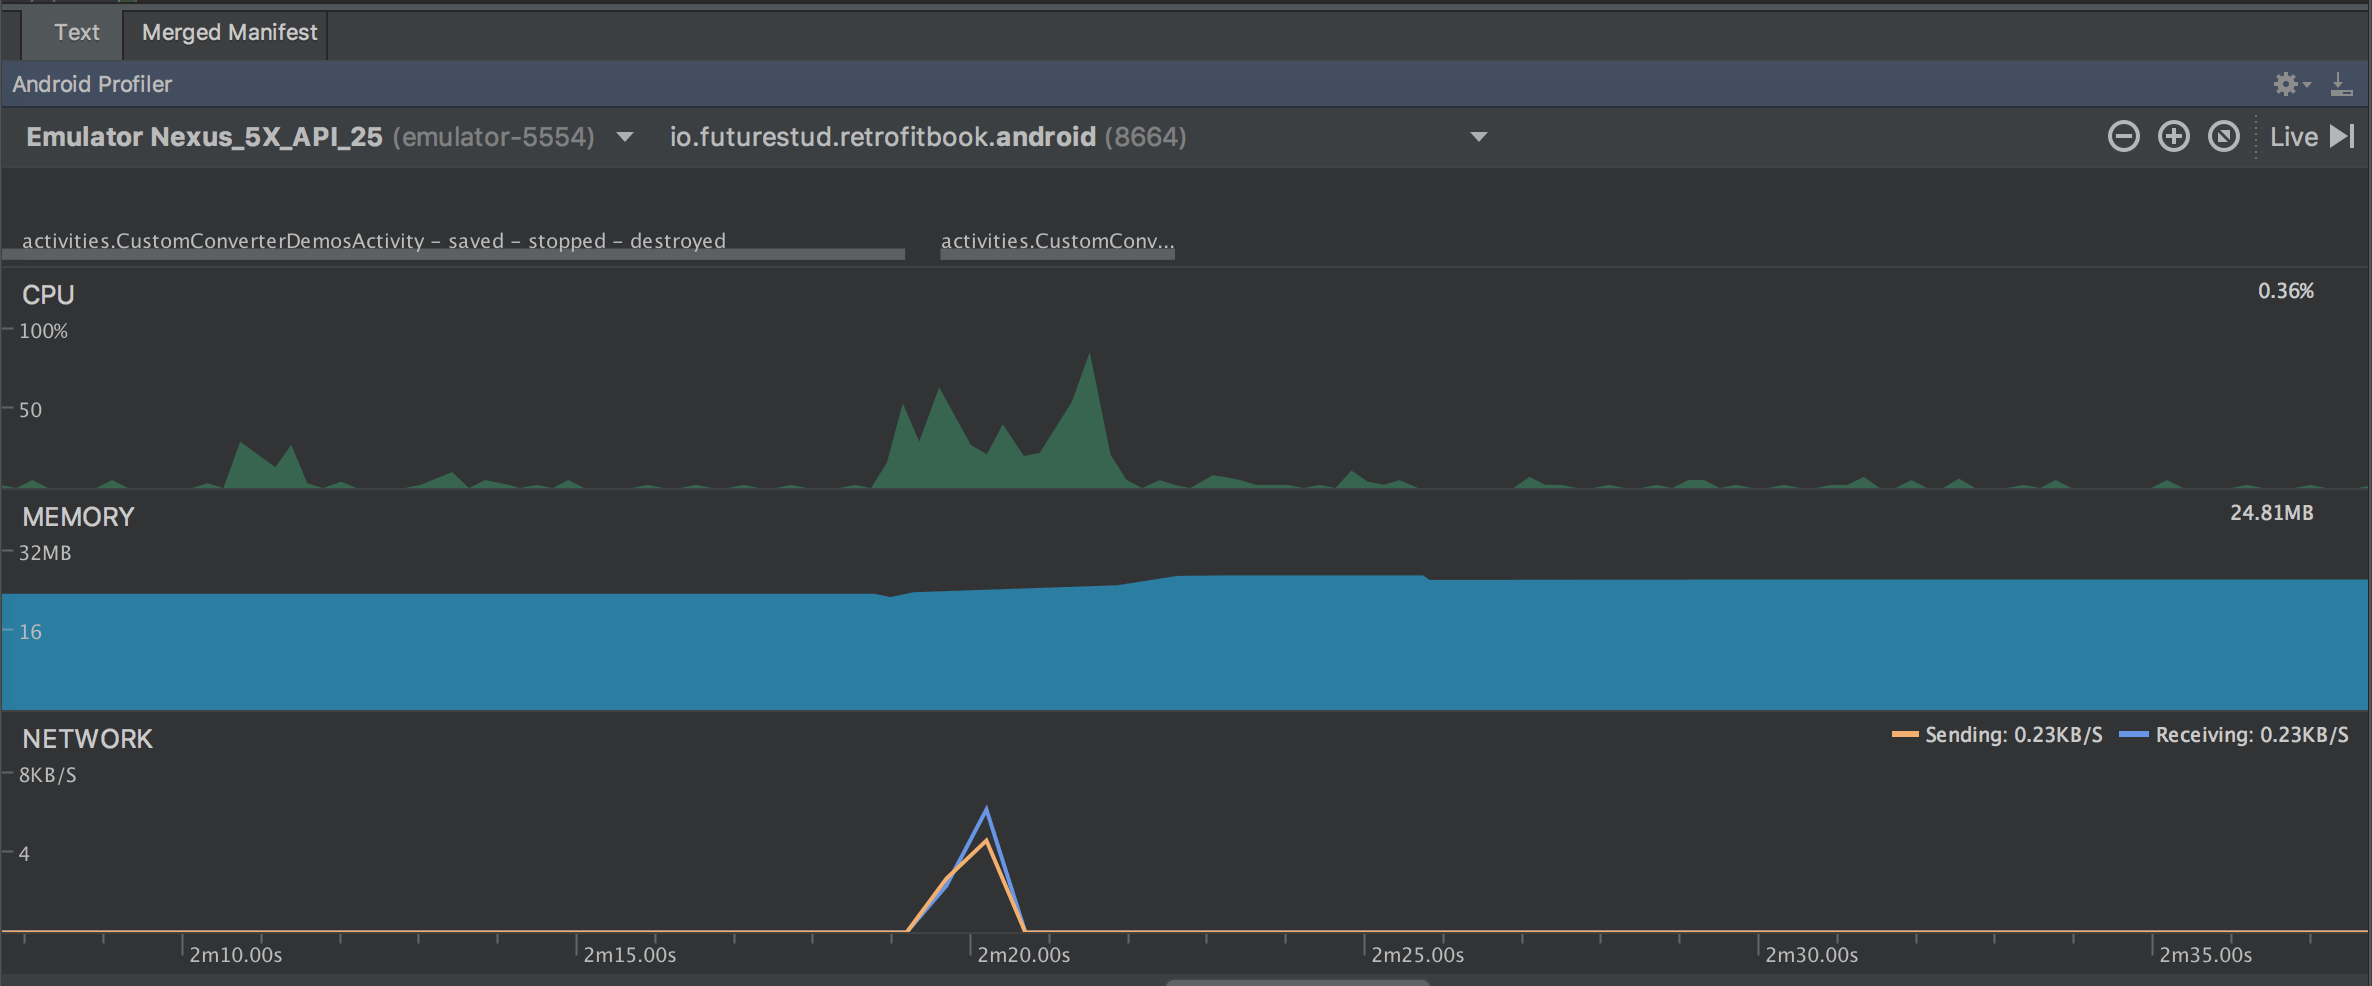
The overview is presented as a constantly updated timeline and already gives you valuable information how UI events, CPU and memory usage and the network traffic are correlated.
Because this tutorial is focused on the network part, you can click into the network section to open up a detailed network view.
Network View
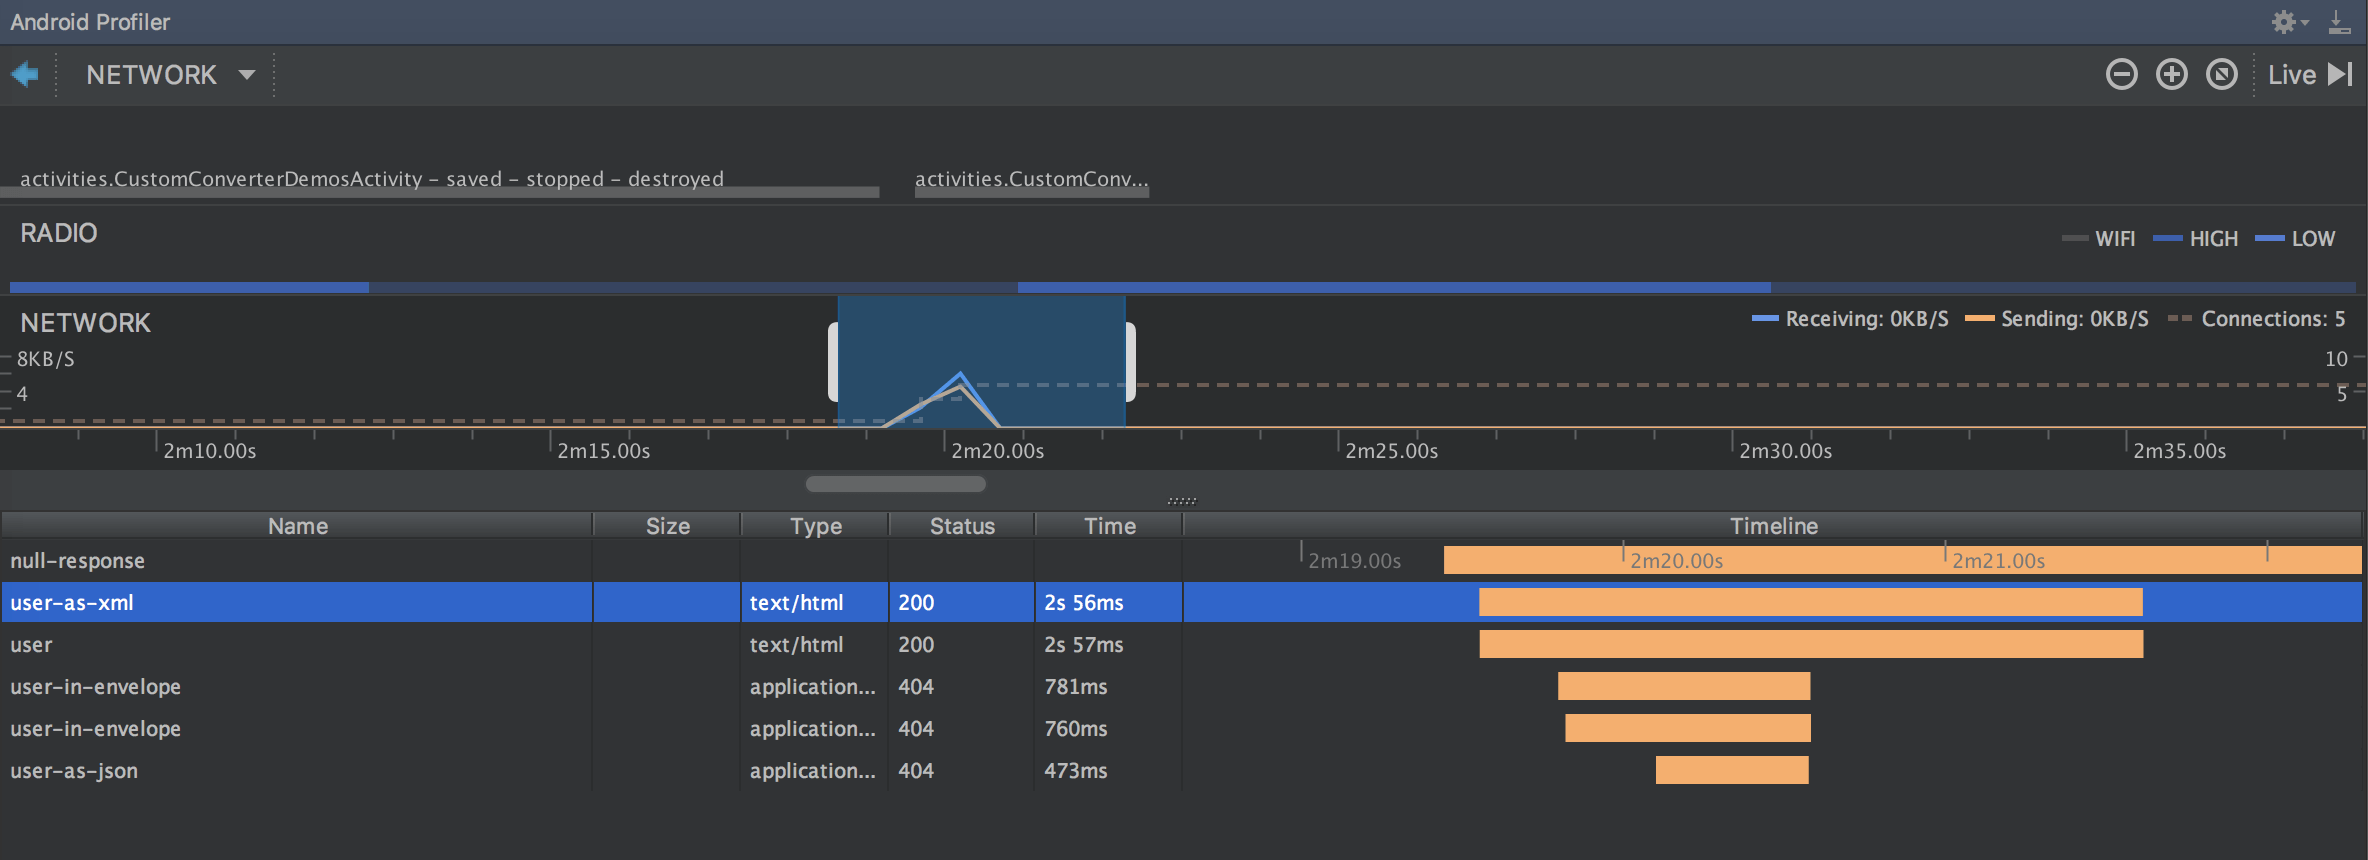
In the network view you'll see all requests, when they were made and how long it took to complete them. This is presented in a convenient timeline, and additionally in a list.
When you click on a specific request, you can drill deeper into that request.
Request Details
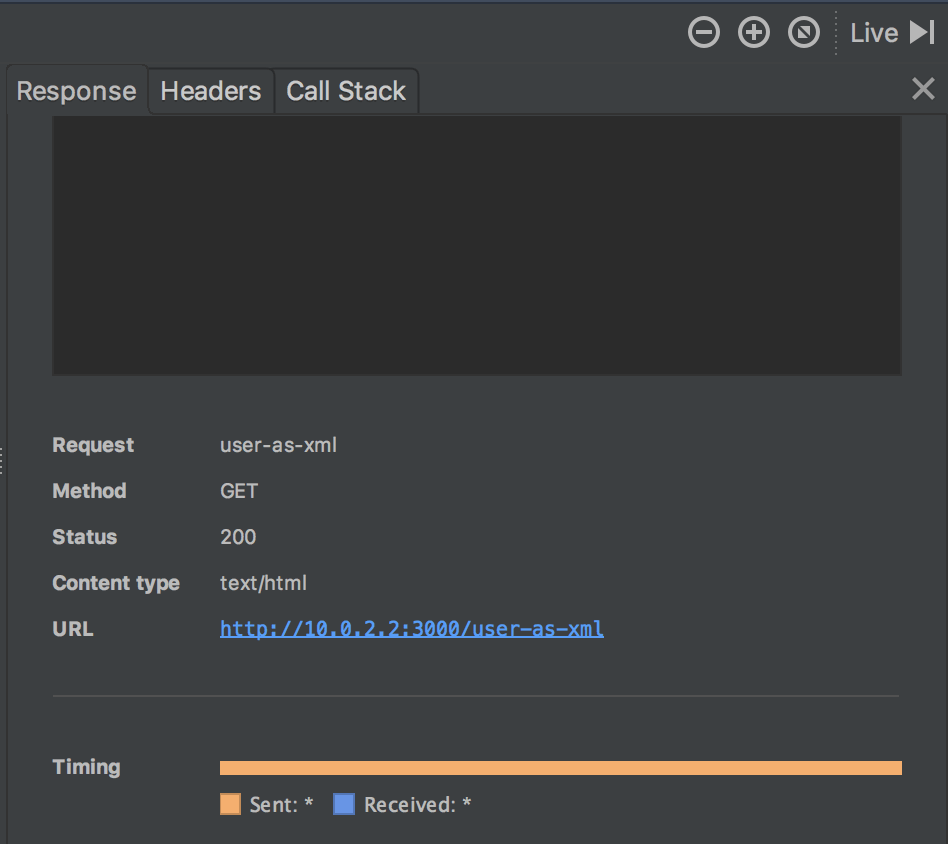
This detail view offers you exact information about the payload, the headers and meta data about the request. Additionally, you can also see the call stack of the network activity and understand where your code started the network request.
Summary
In this tutorial you've seen an overview of the network element of the Android Profiler in Android Studio. The Android Profiler let's you analyze the network traffic without adding any code to your app, and offering a novel presentation of the data. Depending on your needs, it might be a superior solution to an OkHttp interceptor or Stetho.
Do you have further questions on this topic or about Retrofit in general? Just let us know on Twitter @futurestud_io or leave a comment below.
Enjoy coding & make it rock!
Resources
- Network Profiler in Android Developer Docs