In a previous tutorial, you've learned how to log requests and responses in Retrofit using an OkHttp interceptor. The interceptor is set up in a few minutes, but has the disadvantage of logging everything to the Android log, which is not the easiest way to access the complex information.
In this tutorial, you'll learn how you can analyze requests and responses using Facebook's Stetho debug tool. Stetho maps Retrofit's network activity to Chrome's developer tool. This offers the network information during the development phase in a more accessible way, which you'll appreciate over time. However, you'll need to do a litte more preparation than with the OkHttp interceptor. In the next few minutes, we'll guide you through each step.
Retrofit Series Overview
- Getting Started and Creating an Android Client
- Basics of API Description
- Creating a Sustainable Android Client
- URL Handling, Resolution and Parsing
- How to Change API Base Url at Runtime
- Multiple Server Environments (Develop, Staging, Production)
- Share OkHttp Client and Converters between Retrofit Instances
- Upgrade Guide from 1.9
- Beyond Android: Retrofit for Java Projects
- How to use OkHttp 3 with Retrofit 1
- Synchronous and Asynchronous Requests
- Send Objects in Request Body
- Add Custom Request Header
- Manage Request Headers in OkHttp Interceptor
- Dynamic Request Headers with @HeaderMap
- Multiple Query Parameters of Same Name
- Optional Query Parameters
- Send Data Form-Urlencoded
- Send Data Form-Urlencoded Using FieldMap
- How to Add Query Parameters to Every Request
- Add Multiple Query Parameter With QueryMap
- How to Use Dynamic Urls for Requests
- Constant, Default and Logic Values for POST and PUT Requests
- Cancel Requests
- Reuse and Analyze Requests
- Optional Path Parameters
- How to Send Plain Text Request Body
- Customize Network Timeouts
- How to Trust Unsafe SSL certificates (Self-signed, Expired)
- Dynamic Endpoint-Dependent Interceptor Actions
- How to Update Objects on the Server (PUT vs. PATCH)
- How to Delete Objects on the Server
- Introduction to (Multiple) Converters
- Adding & Customizing the Gson Converter
- Implementing Custom Converters
- How to Integrate XML Converter
- Access Mapped Objects and Raw Response Payload
- Supporting JSON and XML Responses Concurrently
- Handling of Empty Server Responses with Custom Converter
- Send JSON Requests and Receive XML Responses (or vice versa)
- Unwrapping Envelope Responses with Custom Converter
- Wrapping Requests in Envelope with Custom Converter
- Define a Custom Response Converter
- Log Requests and Responses
- Enable Logging for Development Builds Only
- Log Network Traffic with Stetho and Chrome Developer Tools
- Using the Log Level to Debug Requests
- Analyze Network Traffic with Android Studio Profiler
- Debug and Compare Requests with RequestBin
Prerequisites
Before we can get started, you need some tools to utilize Stetho. You'll need to install:
- Chrome Browser for the packaged developer tools to display the network activity. But which developer machine doesn't already have Chrome installed within the last two years?
- Android ADB is already installed, if you're using Android Studio. Otherwise, add it to your machine.
Stetho Dependencies
Next, you'll need to add two new Gradle dependencies to your project:
// stetho
compile 'com.facebook.stetho:stetho:1.4.2'

// for OkHttp3, if you're using an older version,
// check the stetho website
compile 'com.facebook.stetho:stetho-okhttp3:1.4.2'
Sync your project and you can move to the next step.
Adding Stetho Logging
Once you opened your Android project, you'll need to modify your app's application class. If you don't have an application class yet, you can add one:
public class MyApplication extends Application {
    public void onCreate() {
        super.onCreate();
        Stetho.initializeWithDefaults(this);
    }
}
Make sure to call Stetho.initializeWithDefaults(this); after the super.onCreate(); method. If you just added the application class for the first time, you'll also need to modify your AndroidManifest.xml and set the MyApplication class as your application:
<manifest package="io.futurestud.stetho"
          xmlns:android="http://schemas.android.com/apk/res/android">

    ...

    <application
        android:icon="@mipmap/ic_launcher"
        android:label="@string/app_name"
        android:name="io.futurestud.stetho.MyApplication"

        ...

    </application>

    ...

</manifest>
Just like with the OkHttp logging interceptor, you need to add an interceptor to Retrofit's OkHttp client. Thus, the next step would be to add a network interceptor to your OkHttp client:
OkHttpClient okHttpClient = new OkHttpClient.Builder()
        .addNetworkInterceptor(new StethoInterceptor())
        .build();

Retrofit.Builder builder = new Retrofit.Builder()
        .baseUrl("http://futurestud.io/api")
        .client(okHttpClient)
        .addConverterFactory(GsonConverterFactory.create());

Retrofit retrofit = builder.build();
Every following call with this Retrofit instance will log all requests with Stetho.
It's important to note that this only includes network requests. Requests that are served from the OkHttp cache will not show up! If you want to analyze the cache behavior, you'll need to fall back to the OkHttp logging interceptor.
Access Network Logging in Chrome
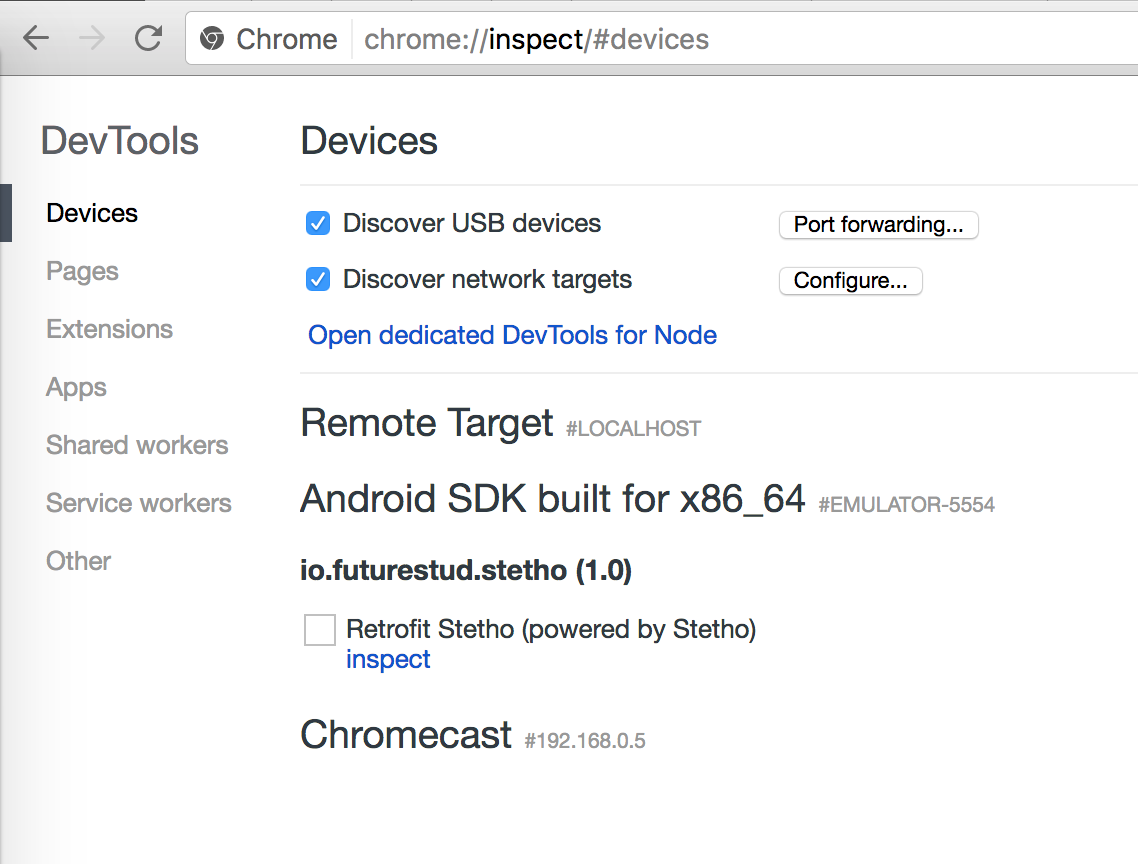
The next time you build your app, Stetho will be ready to go. In order to view the requests, you open the Chrome browser and enter chrome://inspect. You'll then see a list of devices and a list of apps with Stetho enabled. In our case, the Retrofit Stetho app will show up:
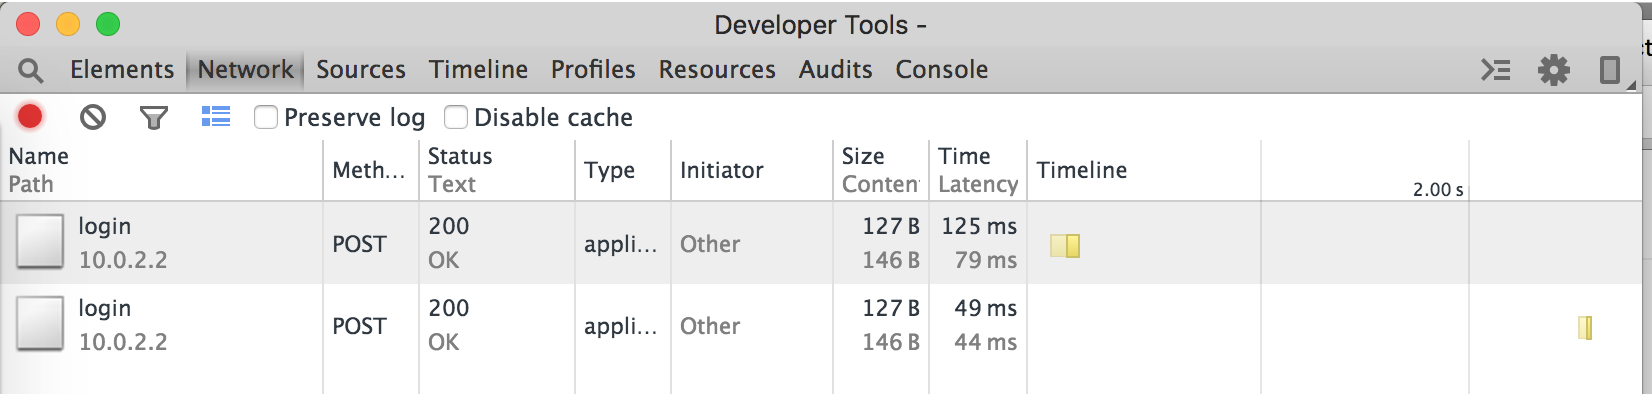
When you click on inspect, you'll open Chrome's regular developer tools. But unlike the usual object of desire, a website, this time it analyzes the app's behavior. Once you switch to the network tab, you'll see the normal visualization and data of all network requests.
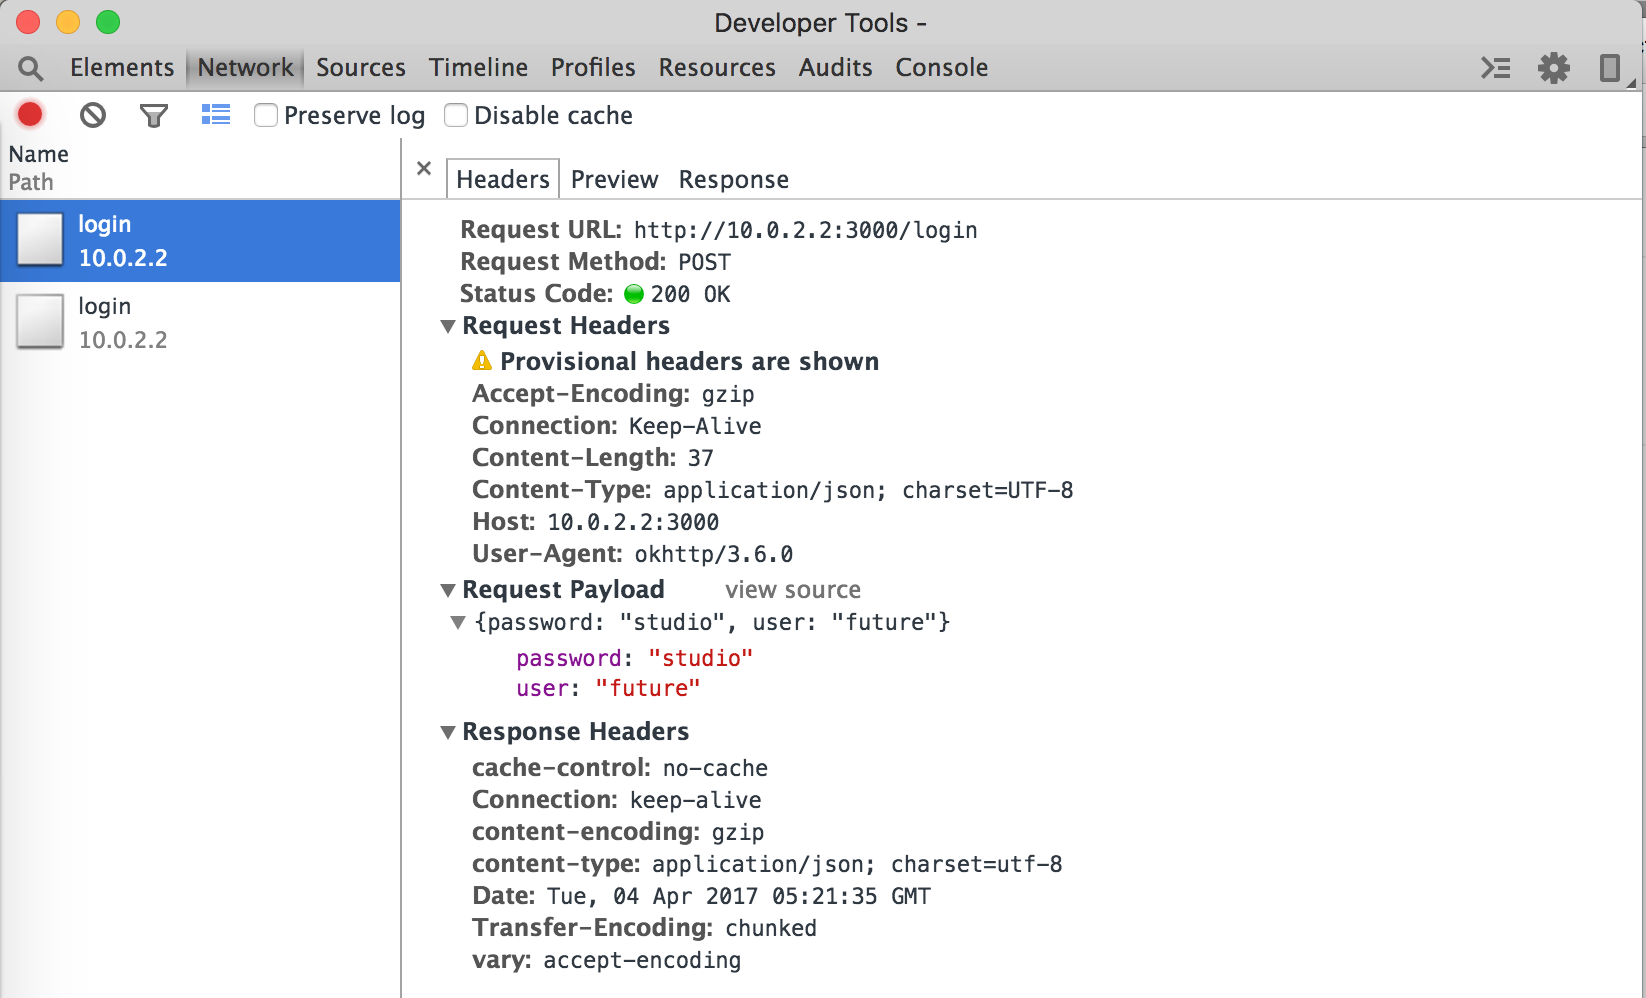
Of course, you can use Chrome's developer tool to get even more information out of every request. Especially when you deal with more complicated request calls this tool makes the information much easier to access than OkHttp's logging interceptor.
One last tip from our side: as always you should minimize logging in production builds. We recommend to only utilize Stetho during the development phase and exclude it from your public version. Especially since you can accidentally log sensitive information (e.g., passwords, credit card numbers)
Stetho can do even more
If you read Stetho's description, it actually offers more than just monitoring of your requests. We recommend to take a minute and see if the other features can benefit you as well.
Summary
In this tutorial you've learned how you can integrate Stetho and utilize the Chrome developer tools to monitor network requests of your app. This can be super helpful and is a nice addition to the OkHttp logging interceptor.
Do you have further questions on this topic or about Retrofit in general? Just let us know on Twitter @futurestud_io or leave a comment below.
Enjoy coding & make it rock!