Creating informative plots is not an easy task. You have to make sure to select a good visualization for the data. Additionally, you have to ensure that the presented data is easy to comprehend.
In the previous tutorial, you have learned to add labels.
In this tutorial, you will learn how to add legends to further explain the data.
Matplotlib Series Overview
How to Add a Legend
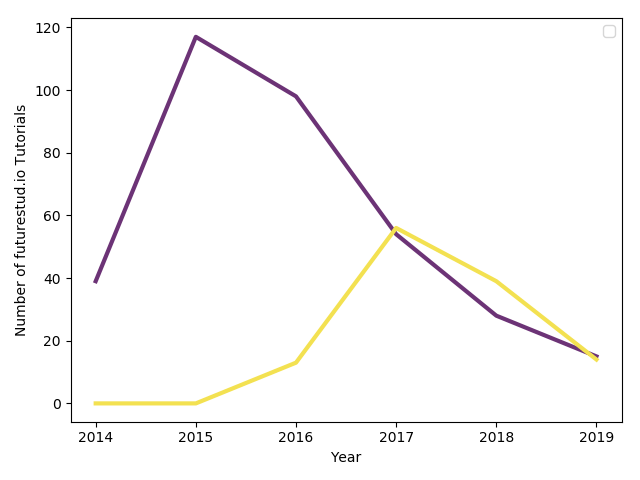
The plot you will be working with in this tutorial is (again) a line plot with the number of tutorials we have published on Future Studio in the past years:
# data
year = [2014, 2015, 2016, 2017, 2018, 2019]
tutorial_public = [39, 117, 98, 54, 28, 15]
tutorial_premium = [0, 0, 13, 56, 39, 14]

# plot
plt.plot(year, tutorial_public, color="#6c3376", linewidth=3)
plt.plot(year, tutorial_premium, color="#f3e151", linewidth=3)

plt.xlabel('Year')
plt.ylabel('Number of futurestud.io Tutorials')

plt.show()
In the current version, the plot doesn't explain what the purple and yellow lines stand for:
In general, you add a legend with matplotlib by calling .legend():
plt.plot(year, tutorial_public, color="#6c3376", linewidth=3)
plt.plot(year, tutorial_premium, color="#f3e151", linewidth=3)

plt.xlabel('Year')
plt.ylabel('Number of futurestud.io Tutorials')

plt.legend() # will not work :(

plt.show()
However, if you would do that with the above code, matplotlib would fail to generate a legend. The problem is that matplotlib doesn't know how to describe the plotted lines. Thus, you have to set a label for each line. The easiest way to do this is by passing an additional parameter during the plot() call:
# add label parameter for easy legend generation
+plt.plot(year, tutorial_public, label='Public Tutorials', color="#6c3376", linewidth=3)
+plt.plot(year, tutorial_premium, label='Premium Tutorials', color="#f3e151", linewidth=3)

plt.xlabel('Year')
plt.ylabel('Number of futurestud.io Tutorials')

plt.legend()

plt.show()
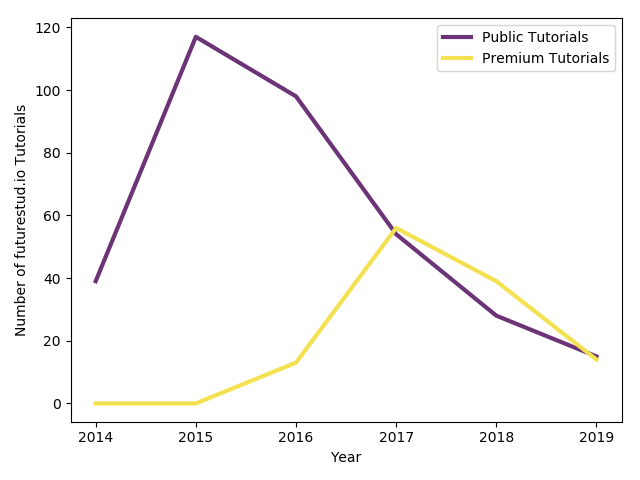
Now the plot appears with a nice legend:
How to Add a Legend (Alternative)
There is an alternative way to set the labels. Instead of declaring them during the plot() call, you could save the first returning object. Then, you pass it as a list to legend() with your labels (also as a list).
# get each line object
+public, = plt.plot(year, tutorial_public, color="#6c3376", linewidth=3)
+premium, = plt.plot(year, tutorial_premium, color="#f3e151", linewidth=3)

plt.xlabel('Year')
plt.ylabel('Number of futurestud.io Tutorials')

# pass the line objects and a proper name
+plt.legend([public, premium], ['Public Tutorials', 'Premium Tutorials'])

plt.show()
The resulting plot is identical:

The advantage of this method is that you do have some more control of which (line) objects should appear in the legend. Chose the way you prefer!
Customize Legends
Of course, this is not it and matplotlib offers an endless amount of further customizations. In this tutorial, you'll only take a look at the tip of the iceberg.
Position and Number of Columns
First, let's change the position of the legend with the loc parameter. By default, matplotlib looks for the best position that has minimal overlap with the plot. In our plot, this is the upper right corner. But, if you need to, you can hardcode the position, for example with upper left.
Furthermore, by default matplotlib puts all entries in a long vertical list. But you can increase the number of colums by passing ncol:
plt.plot(year, tutorial_public, label='Public Tutorials', color="#6c3376", linewidth=3)
plt.plot(year, tutorial_premium, label='Premium Tutorials', color="#f3e151", linewidth=3)
plt.xlabel('Year')
plt.ylabel('Number of futurestud.io Tutorials')
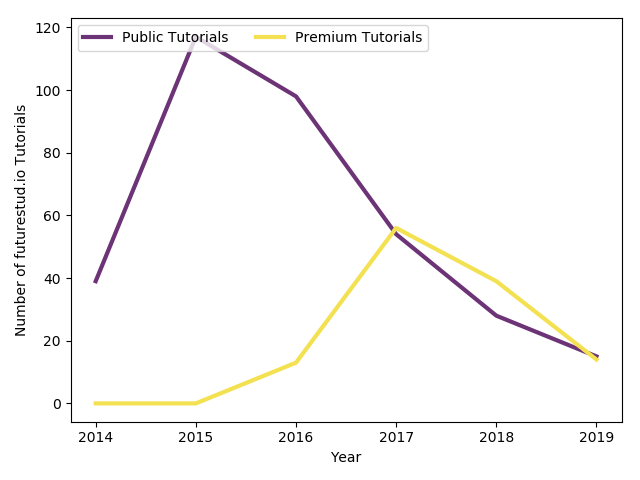
# customize position and number of columns
+plt.legend(loc='upper left', ncol=2)
plt.show()
With these options, the legend is now on the top left and the entries appear next to each other: However, they overlay the lines, so not the best choice.
Title, Frame, and Fontsize
Let's move the plot back to the upper right (alternatively, you could remove the parameter entirely or pass best for the same result).
Next, we need a legend for the legend. You can set a title by passing a string.
Finally, as you are adding text, you have the typical font options such as fontsize:
plt.plot(year, tutorial_public, label='Public Tutorials', color="#6c3376", linewidth=3)
plt.plot(year, tutorial_premium, label='Premium Tutorials', color="#f3e151", linewidth=3)
plt.xlabel('Year')
plt.ylabel('Number of futurestud.io Tutorials')
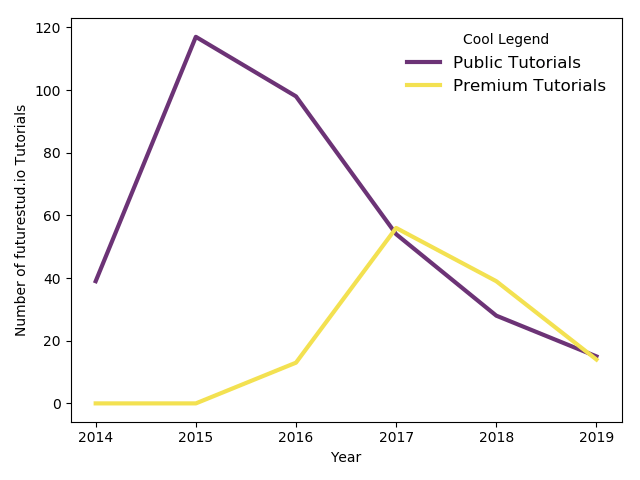
# some more options
+plt.legend(loc='upper right', title='Cool Legend', frameon=False, fontsize='large')
plt.show()
With these options, you will obtain the following plot:
Feel free to browse through the legend API documentation for many more options that could be interesting to you.
Summary
In this tutorial, you have learned how to add basic legends to your plots. They are a big step to creating sweet plots.
All code is also available for easy copy & paste on a GitHub repository.
Do you have questions or feedback where this series should go? Let us know on Twitter @futurestud_io or leave a comment below.
Enjoy plotting & make it rock!
Mentioned Resources
- Add labels tutorial
- matplotlib documentation on legend API
- GitHub repository of matplotlib tutorials