In our tutorial series on matplotlib, you have learned how create many different plots and how to customize their design. So far, you have looked at the resulting plot by calling .show(). But what if you need to share the plot? For example, if you need to send it in an email or use it in a presentation?
In this tutorial, you will learn how to export plots and save them in different file formats.
Matplotlib Series Overview
Sample Line Plot
Before you can experiment with different export options, you need a plot to export 🙂
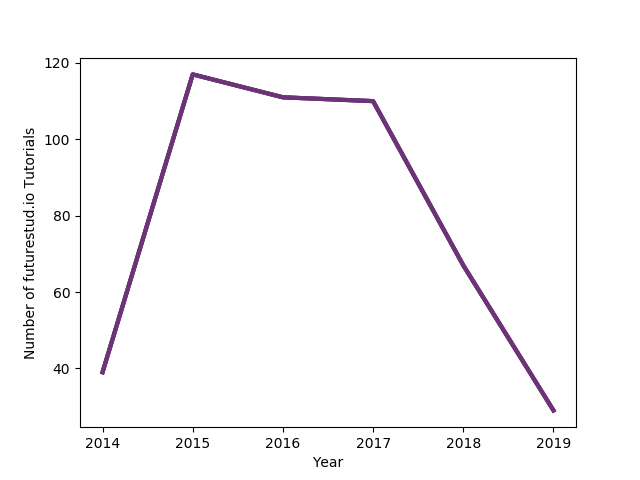
For the rest of this tutorial, you can use a simple line plot because it's especially suitable to see quality differences:
year = [2014, 2015, 2016, 2017, 2018, 2019]
tutorial_count = [39, 117, 111, 110, 67, 29]

plt.plot(year, tutorial_count, color="#6c3376", linewidth=3)
plt.xlabel('Year')
plt.ylabel('Number of futurestud.io Tutorials')

Save as PDF File
If you want to export a graph with matplotlib, you will always call .savefig(path). matplotlib will figure out the file type based on the passed file path .
For example, if you want to save the above plot in a PDF file:
plt.savefig('line_plot.pdf')
This will save the plot in line_plot.pdf. You can view all output files here.
Save as SVG File
If you want to save the plot as a SVG file instead, you use the same .savefig(path) method, but change the file ending to .svg:
plt.savefig('line_plot.svg')
Both PDF and SVG are vector-based file formats and save the plot in excellent quality.
However, some software does not easily support these modern formats (looking at you, PowerPoint) and requires you to export plots as images. Luckily, this is not a problem with matplotlib.
Save as PNG File
You hopefully understood the pattern and can guess how to export a plot as a PNG file. Simply pass a path to .savefig() with a png file ending:
plt.savefig('line_plot.png')
Quality
All image-based file formats, such as PNG or JPG, will come with some quality loss. You can increase (or decrease) the quality of the plot by setting the dpi. For example, if you want to create a higher quality PNG export:
plt.savefig('line_plot_hq.png', dpi=300)
If you take a closer look, this will make the plot a lot nicer. However, keep in mind that it also tripled the file size! If you need to export plots to an image format, there is a trade-off between quality and file size.
Color Options
Exporting to PNG does have one advantage over JPG. PNG allows transparent colors. By default, matplotlib creates plots on a white background and exports them as such. But you can make the background transparent by passing transparent=true to the savefig() method:
plt.savefig('line_plot_hq_transparent.png', dpi=300, transparent=True)
This can make plots look a lot nicer on non-white backgrounds.
In general, the order of passed parameters does not matter. You can set them however you want to.
Save as JPG File
The final export options you should know about is JPG files, which offers better compression and therefore smaller file sizes on some plots.
plt.savefig('line_plot.jpg', dpi=300)
JPG Options
matplotlib offers some optional export options that are only available to .jpg files. For example, quality (default 95), optimize (default: false), and progressive (default: false).
plt.savefig('line_plot.jpg', dpi=300, quality=80, optimize=True, progressive=True)
With the above options enabled, the file size is reduced by 50% while keeping the quality on a similar level.
Which Export Format to Use?
The export as vector-based SVG or PDF files is generally preferred over bitmap-based PNG or JPG files as they are richer formats, usually providing higher quality plots along with smaller file sizes.
If you want to see the effect of the different data formats, zoom up close onto the line plot. With the PDF and SVG format, it will still be a smooth, straight line (left). However, with PNG or JPG, it'll be clunky (right).

Summary
In this tutorial, you have learned how to export files in a variety of file formats and some of options to control plot quality.
All code and sample exports are available for easy copy & paste and a closer look on a GitHub repository.
Do you have questions or feedback where this series should go? Let us know on Twitter @futurestud_io or leave a comment below.
Enjoy plotting & make it rock!
Mentioned Resources
- GitHub repository with sample code and sample output files